Mortality in a postmodern age
Jan
|
Feb
|
||
2015
|
60,891
|
46,721
|
|
2016
|
47,457
|
46,021
|
|
2017
|
57,368
|
47,766
|
|
2018
|
64,154
|
49,177
|
|
2019
|
53,910
|
45,796
|
|
2020
|
56,706
|
43,653
|
Update April 3
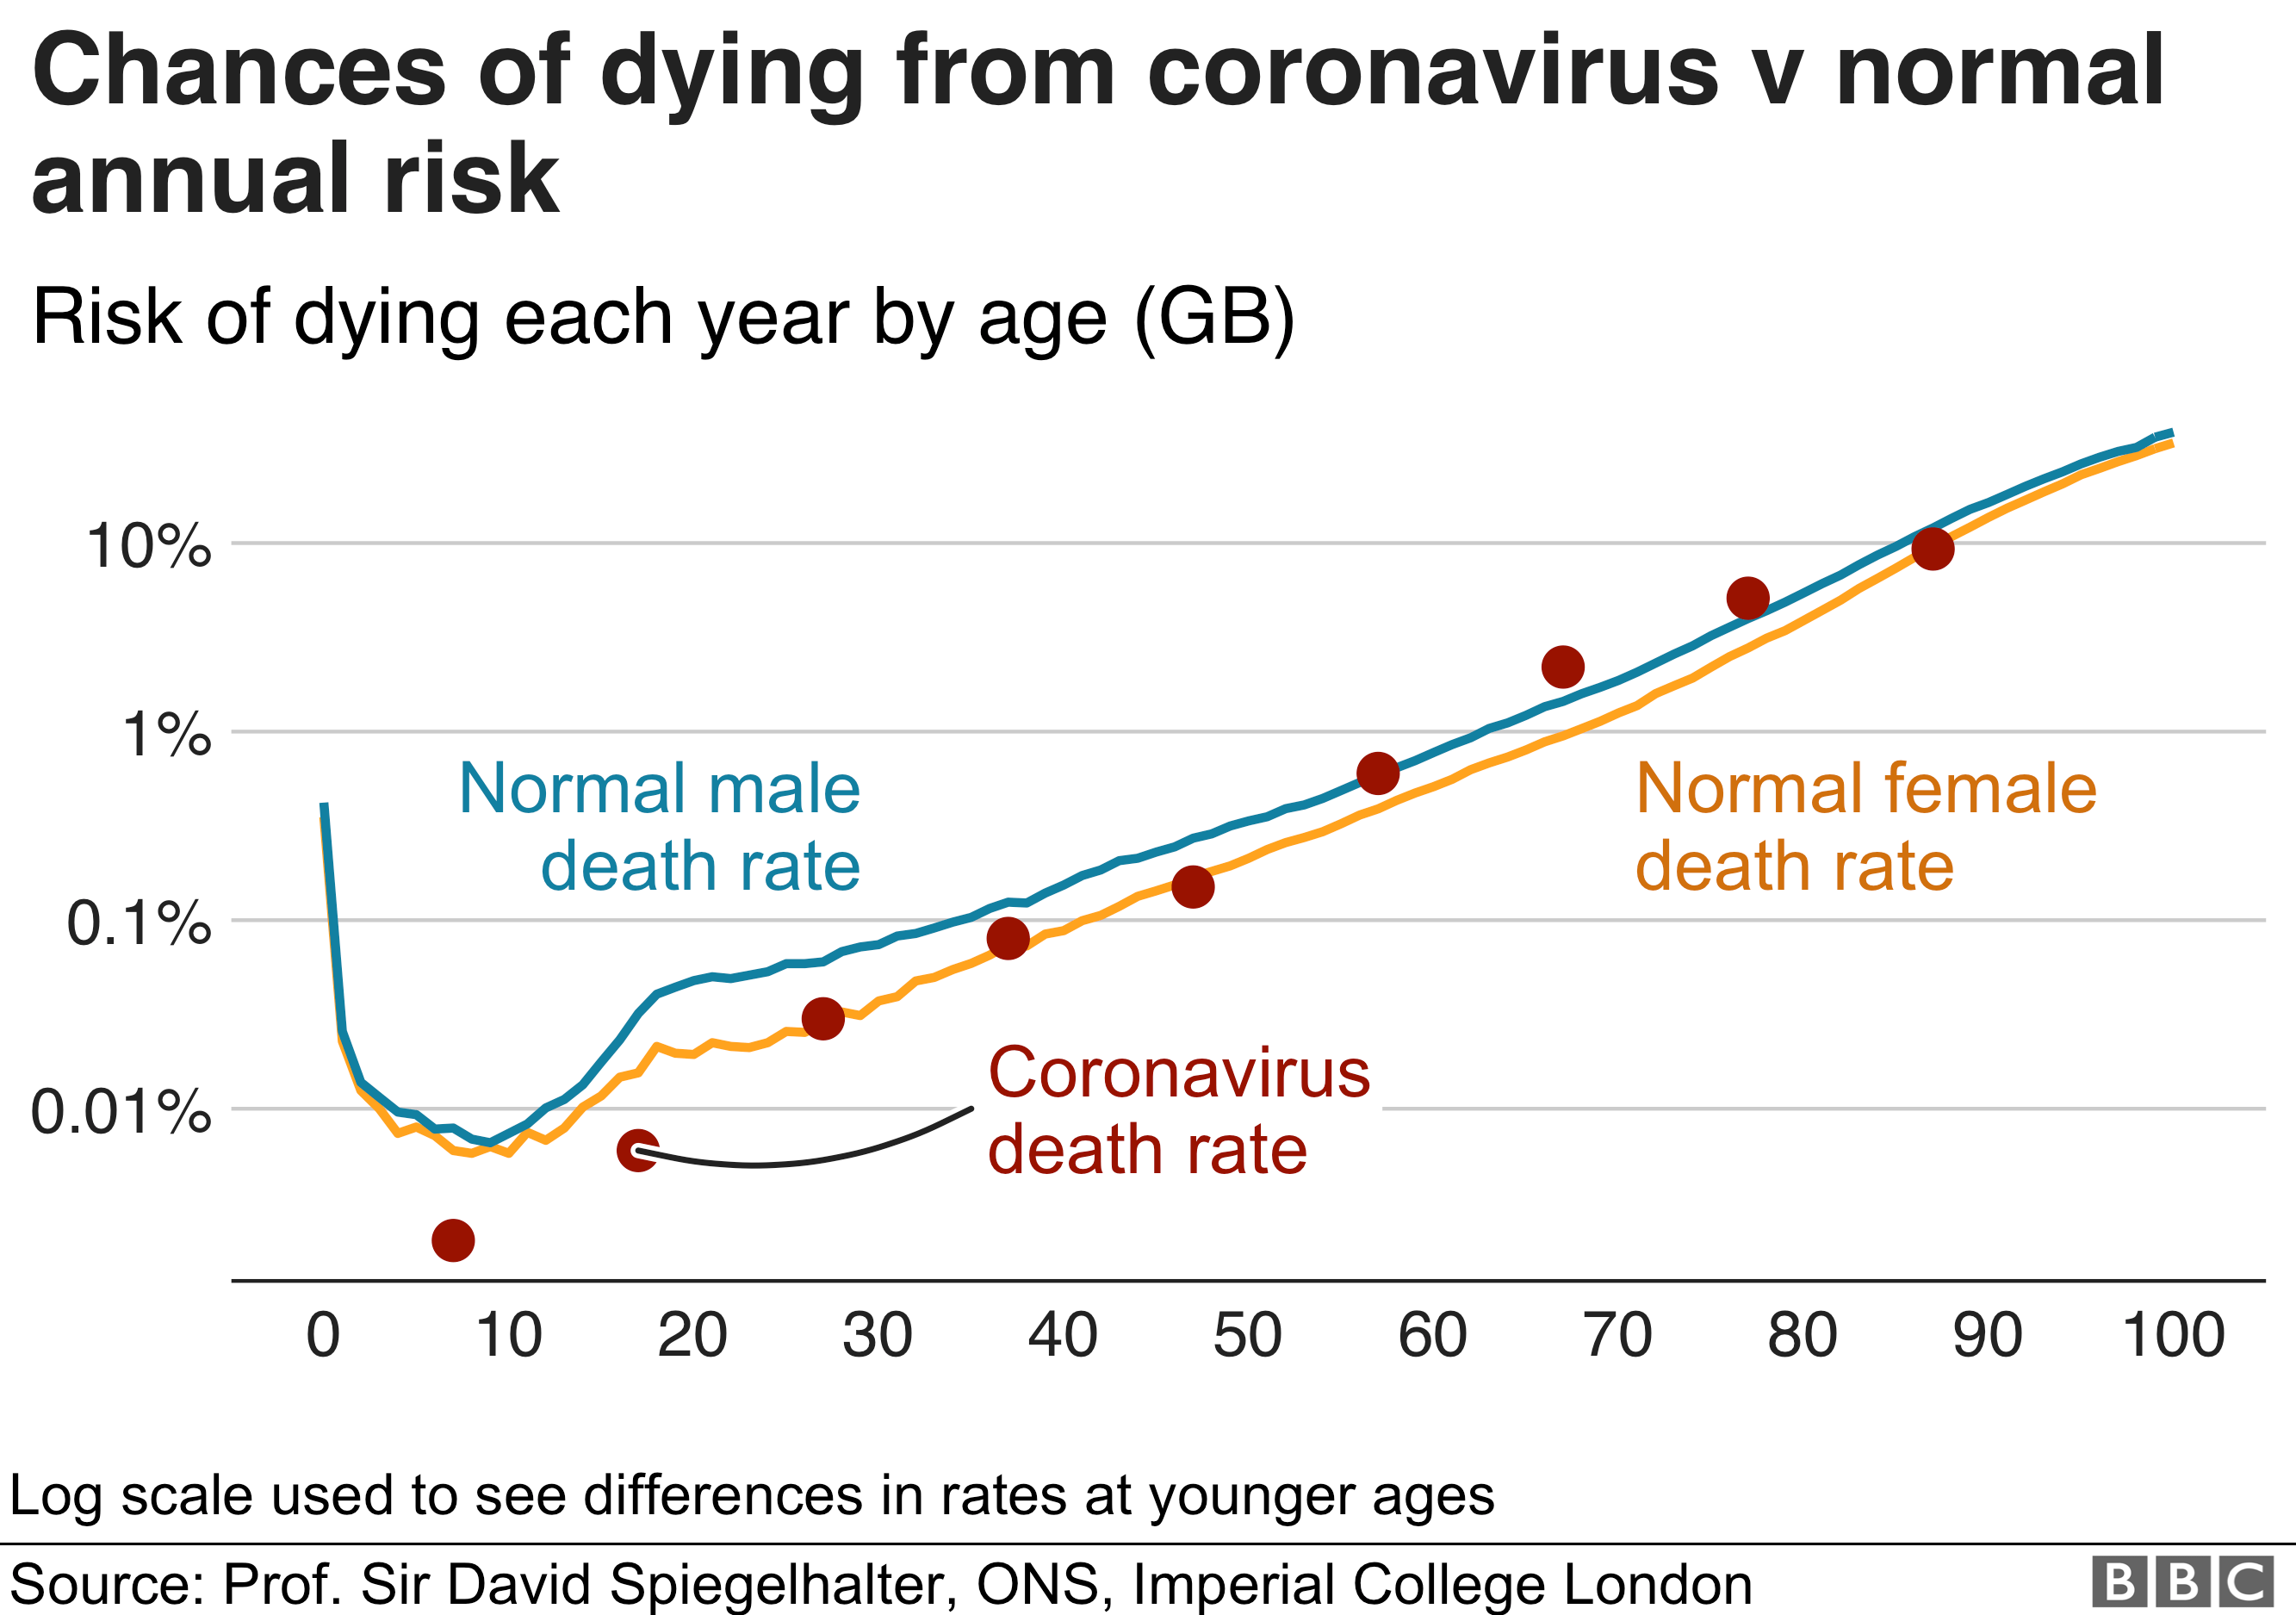
The following table is appended to Nick Triggle's article of April 1.

This model would seem to suggest that except for those under 25 (where the death rate is appreciably lower than the norm, overall death rates are largely unchanged with the presence of coronavirus. The figures for hospital deaths with coronavirus present were 582 for the week of March 21-March 27 and 2,846 for the week of March 28-April 3, but this assumes that the presence of coronavirus precipitated death. A comparison of deaths in early 2018 and 2019, reveals the weekly excess to have been 2,313 in January, 845 in February, and 1,644 in March.
Update April 7
The Week 13 figures have just been released, showing deaths to be 11,141, the highest in six years. Those attributed to all respiratory diseases are 1,534, more than 2017 and 2019, but less than 2015, 2016 and 2018. For weeks 10-13 (covering most of March in 2020), the total number of deaths was 43,974, the second-highest in five years, but still 3,665 less than 2018. This means that, in the first quarter of the year there were still 16,500 fewer deaths in 2020 than in 2018.
From March 28 to to April 3 there have been about 2,800 further deaths attributed to coronavirus. Averaging all deaths over the past five years suggests one might expect to see around 10,800 deaths for this period (though possibly as high as 11,500). The extent to which the reported figure exceeds 12,000 may well be the best guide.
Update April 14
The Week 14 figures report deaths as 16,387, of which 3,475 mention the presence of Covid-19 (21.2 percent). This weekly figure is appreciably higher than any over the past five years (in Week 2 of January 2018 there were 15,050 deaths). The weekly excess for Week 14 alone is 5,500 deaths, although two-fifths of that are not attributed to coronavirus (unless these reflect undiagnosed at-home deaths). There have now been four successive days of declining numbers of deaths but it has been the Easter Weekend, so today's release of figures will likely indicate whether it is yet a trend. Hospital admissions thankfully appear to have plateaued.
Update April 22
Entering Week 15 we find deaths to have reached 18,516, of which 6,213 mention the presence of Covid-19 (33.5 percent). This weekly figure is the highest for the twenty-first century. The weekly excess for Week 15 alone is 8,000 deaths, although a quarter of these are not attributed to coronavirus. In just two weeks, we have reached 80 percent of the excess deaths in the first three months of 2018.
Update May 7
Over the course of Weeks 16 and 17, overall deaths rose to 22,351 before falling back slightly to 21,997, reflecting a two-weekly excess of 23,393. Deaths attributed to coronavirus were 8,758 in Week 16 and 8,237 in Week 17, with ONS figures finally reflecting the beginning of a decline in deaths. However, around 6,000 deaths over these two weeks do not appear to be attributable to Covid-19, perhaps collateral damage from the decreased use of the NHS for other health conditions. Over a five-week period there appears to have been around 38,000 excess deaths, of which around 27,000 have a Covid-19 connection. This compares with 5,000 fewer deaths compared to the five-year average in the first twelve weeks of the year. All-cause mortality for the five week period went from 9,675 a week to 18,078 a week.


